Introduction
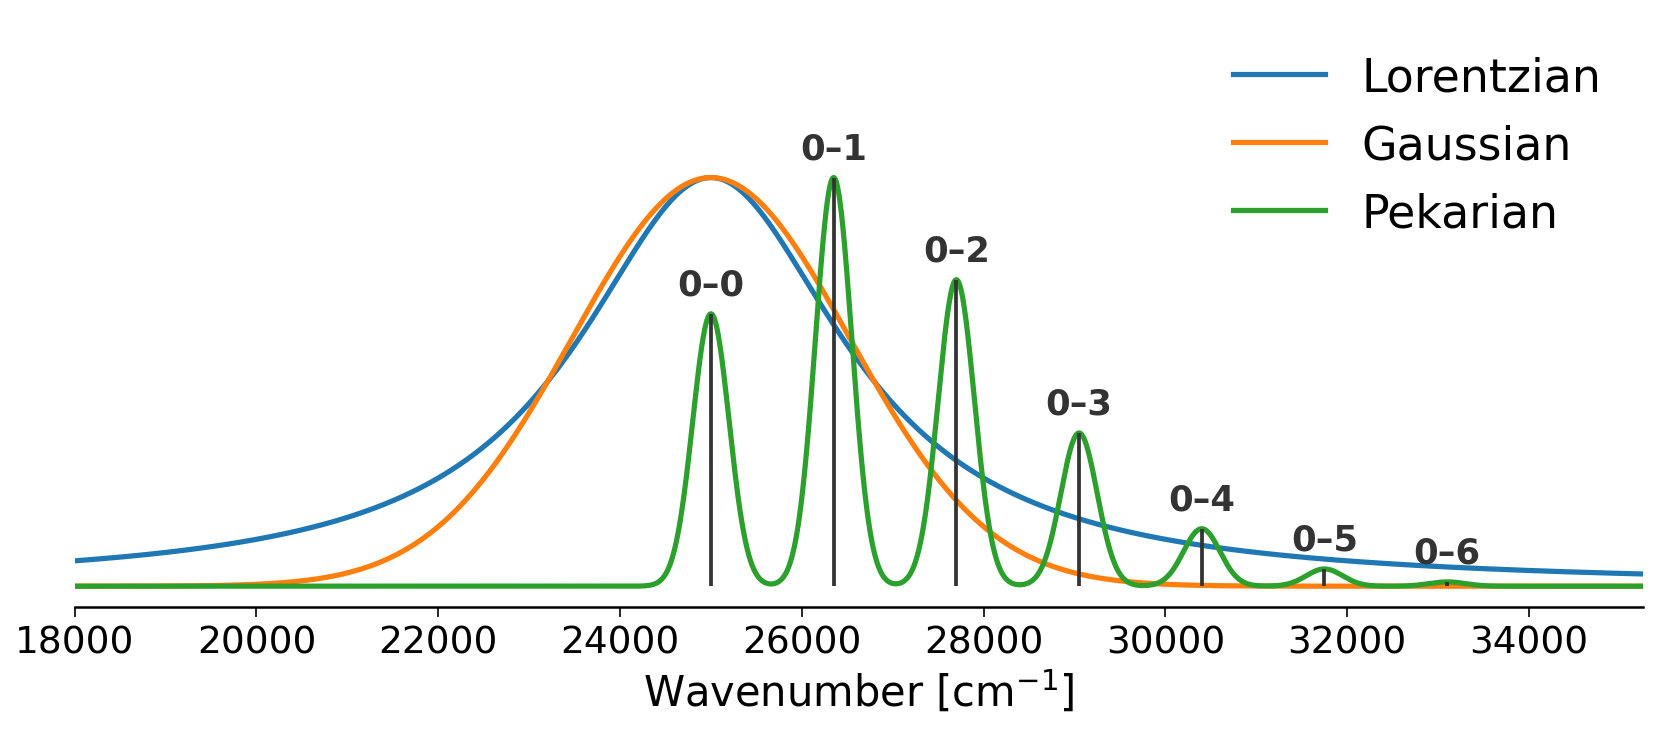
HQS-UV-Vis provides UV/visible spectra with bands at the right position with a correct shape.
Electronic transitions are responsible for absorption and emission in the UV/Vis region. However, pure electronic transitions are an abstratction: in a more realistic picture electronic transitions are followed by changing of vibrational states, e.g. are vibronic = vibrational + electronic. Vibronic transitions define the fine structure of the electronic band, which is in non-trivial: in general it is asymmetric and can exhibit several maxima (so called vibronic progression). HQS-UV-Vis goes beyond pure electronic transition providing physically motivated and informative line shapes in the UV/Vis spectra.
What is HQS-UV-Vis?
HQS-UV-Vis is a toolkit for modeling ultraviolet and visible spectra in molecular systems using physically meaningful band shapes with a simple Python API. The package can compute spectra theoretically and fit theoretical models to experimental spectra. HQS-UV-Vis combines:
- Quantum-chemical calculations (DFTB+)
- Band/line shape models based on the Franck-Condon principle
- Advanced fitting algorithms for experimental electronic spectra
- Multi-state spectral analysis for complex electronic transitions
- Simple lineshape fitting (Gaussian, Lorentzian, Voigt)
- Flexible models: various line shapes for different bands
Key Features
Physical Models
- Franck-Condon Pekarian functions```
- Effective single-mode (ESM) approximations
- Linear coupling model (LCM) for Huang-Rhys factors
- Progressive broadening for inhomogeneous lineshapes
Theory Integration
- DFTB+ gradient and Hessian parsing
- Automatic normal mode analysis
- Multi-state vibronic spectra from multiple electronic states
- Theory-guided parameter initialization
- Automatic broadening parameter estimation
Visualization
- Spectrum comparison plots
- Vibronic progression decomposition
- Multi-component spectral fitting
Use Cases
HQS-UV-Vis is designed for:
- Experimental spectroscopists analyzing UV-Vis absorption or fluorescence
- Computational chemists visualizing quantum chemistry calculations
Getting Started
HQS UV Vis is included in the HQS Spectrum Tools module. To install it you need a running version of HQStage.
Once you have HQStage correctly configured you can install HQS Spectrum Tools using the command:
hqstage install hqs_spectrum_tools
Please note that HQS Spectrum Tools is currently only supported on Linux.
For using HQS UV Vis DFTB+ must be installed and available in your system PATH. You can obtain DFTB+ from:
- Using conda install "dftbplus=25.1=nompi_*"
- Official website: https://dftbplus.org/
- GitHub releases: https://github.com/dftbplus/dftbplus/releases
Verify your installation by running dftb+ in your terminal.
Slater-Koster Parameters
What are Slater-Koster files? Slater-Koster (SK) files contain the parametrized tight-binding integrals for element pairs (e.g., C-C, C-H, O-H). These are required for all DFTB+ calculations.
Download: SK parameter sets are available at: https://dftb.org/parameters/download.html
Recommendation: We recommend the 3ob-3-1 parameter set, which provides good accuracy for organic and biological molecules containing H, C, N, O, P, S, and halogens.
Continue to the Theory section to understand the theoretical foundations of UV/Vis spectral analysis.
License
HQS-UV-Vis is developed by HQS Quantum Simulations GmbH.
Copyright © 2026 HQS Quantum Simulations GmbH. All Rights Reserved.