NMR spectra calculations
calculate_spectrum
For most use cases the calculate_spectrum function should be sufficient to perform NMR spectra calculations. By default, it uses the clustering approach discussed in the solver chapter. This approach is exact for molecules smaller than the specified maximum cluster size (set by default to 12) and for larger systems still accurate and efficient.
For a quick introduction to this method you can just read on, however, for a proper walkthrough of all the customization options check out the example notebooks.
The calculate_spectrum function takes as input an object with the molecular data of the system of interest which can be of type MolecularData or NMRParameters. The latter is derived from the former using the spin_system method and only stores the isotopes, chemical shifts and J-coupling values. The second input argument of calculate_spectrum is of type NMRCalculationParameters and stores all parameters necessary to specify a NMR spectrum calculation. For more details on these objects check out the corresponding sections molecular data and data types.
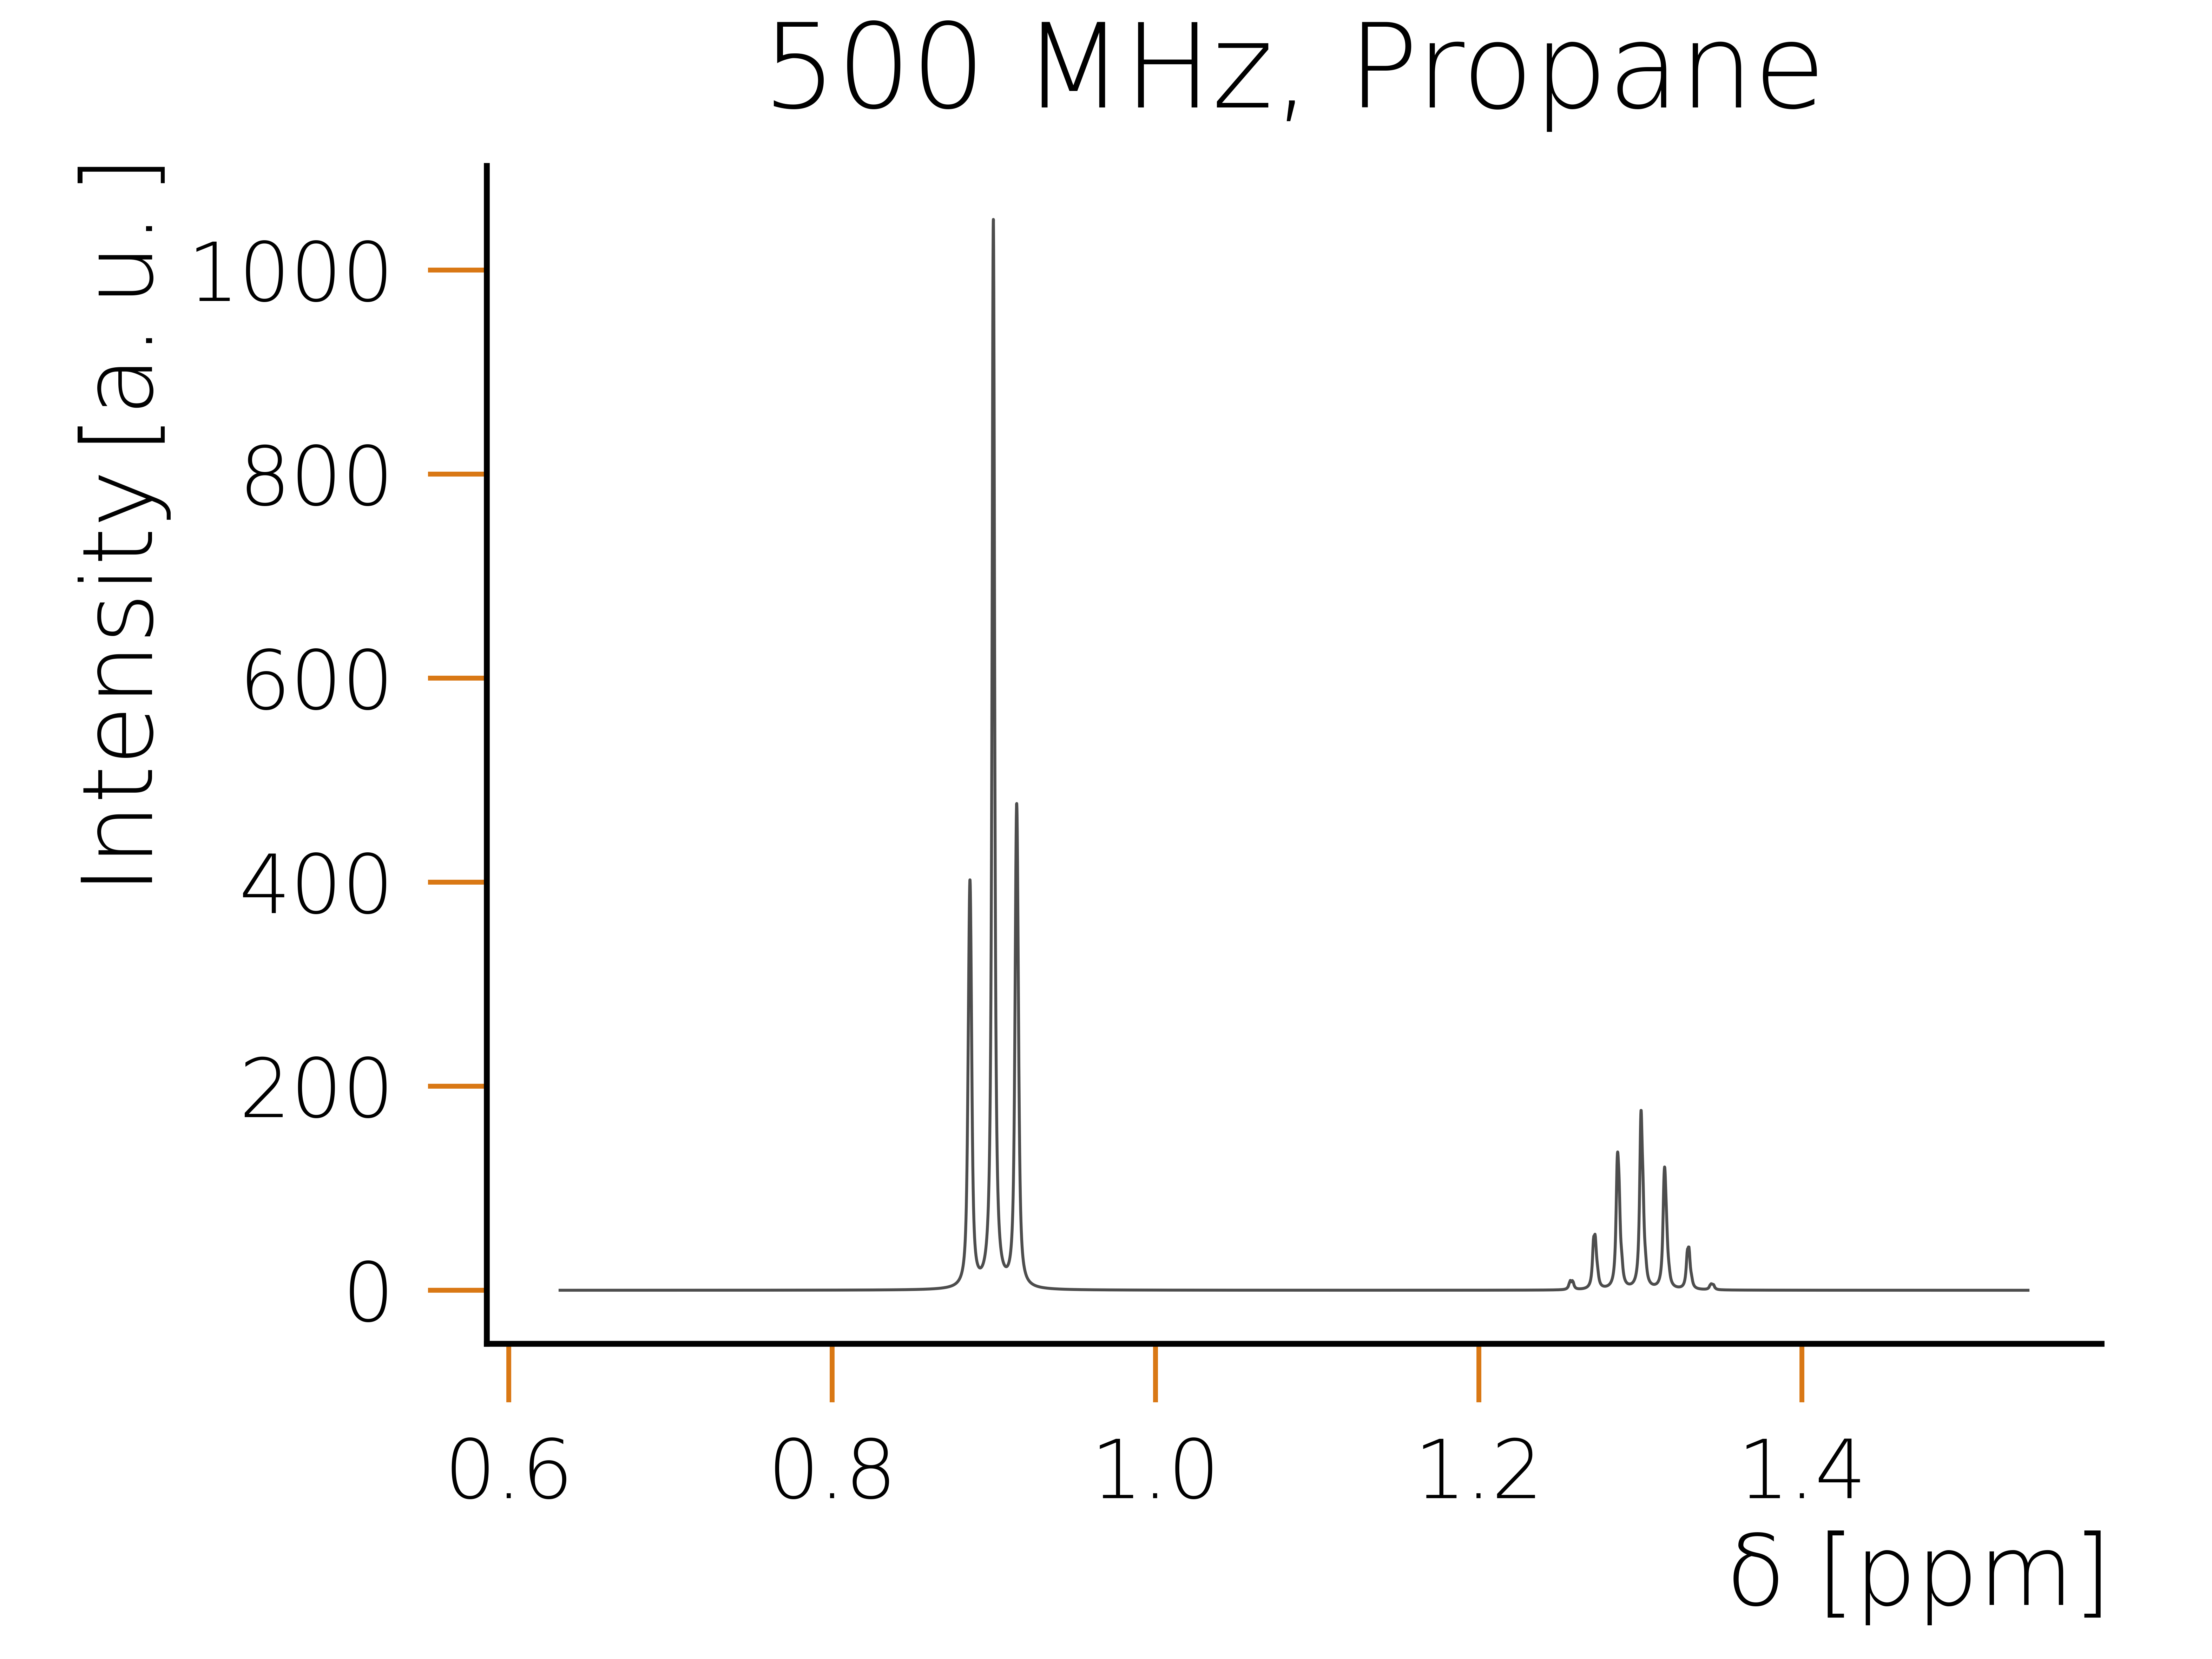
As part of HQS Spectrum Tools the hqs-nmr-parameters package containing example molecules is provided. You can calculate the spectrum for one of the example molecules simply as follows:
from hqs_nmr.calculate import calculate_spectrum
from hqs_nmr.datatypes import NMRCalculationParameters
from hqs_nmr_parameters.examples import molecules

# Obtain example molecule of datatype NMRParameters.
molecule_parameters = molecules["C3H8"].spin_system()

# Define the calculation parameters. The only required field is the magnetic
# field strength in Tesla.
calculation_parameters = NMRCalculationParameters(field_T=11.7433)

# Calculate the individual spin contributions of the spectrum.
nmr_result = calculate_spectrum(
    molecule_parameters,
    calculation_parameters
)
nmr_result is now an object of datatype NMRResultSpectrum1D and stores the calculated spectrum as well as the input to the calculation. The spectrum can be plotted as follows:
from hqs_nmr.visualization import plot_spectrum
from matplotlib import pyplot as plt

plot_spectrum(nmr_result.spectrum)
plt.show()